First Annual Reader Survey

Over the last couple weeks I polled the growing community of readers of my newsletter in our first annual reader survey.
My goal was to get a bead on how close to the mark the newsletter is hitting. What I actually learned might shock you. I mean it probably won't, but there's always a chance. I did at least attempt to extrapolate wildly and draw irrespsoible conclusions from a small data set.
The survey was ten questions long and on average took participants 4:35 to complete. There were hard-hitting questions on there about the newsletter, how they were feeling that day, what they were listening to, etc.
Wading through the results I began to get a sense for my readers and they're hopes dreams, and fears.
I was enthralled to learn that my readers reported having fascinating weekend plans, ranging from "I'm in a toilet in [redacted European capital] and I'm looking forward to going home" to "Hanging with my Mom!" to "Surviving." What a group you all are.
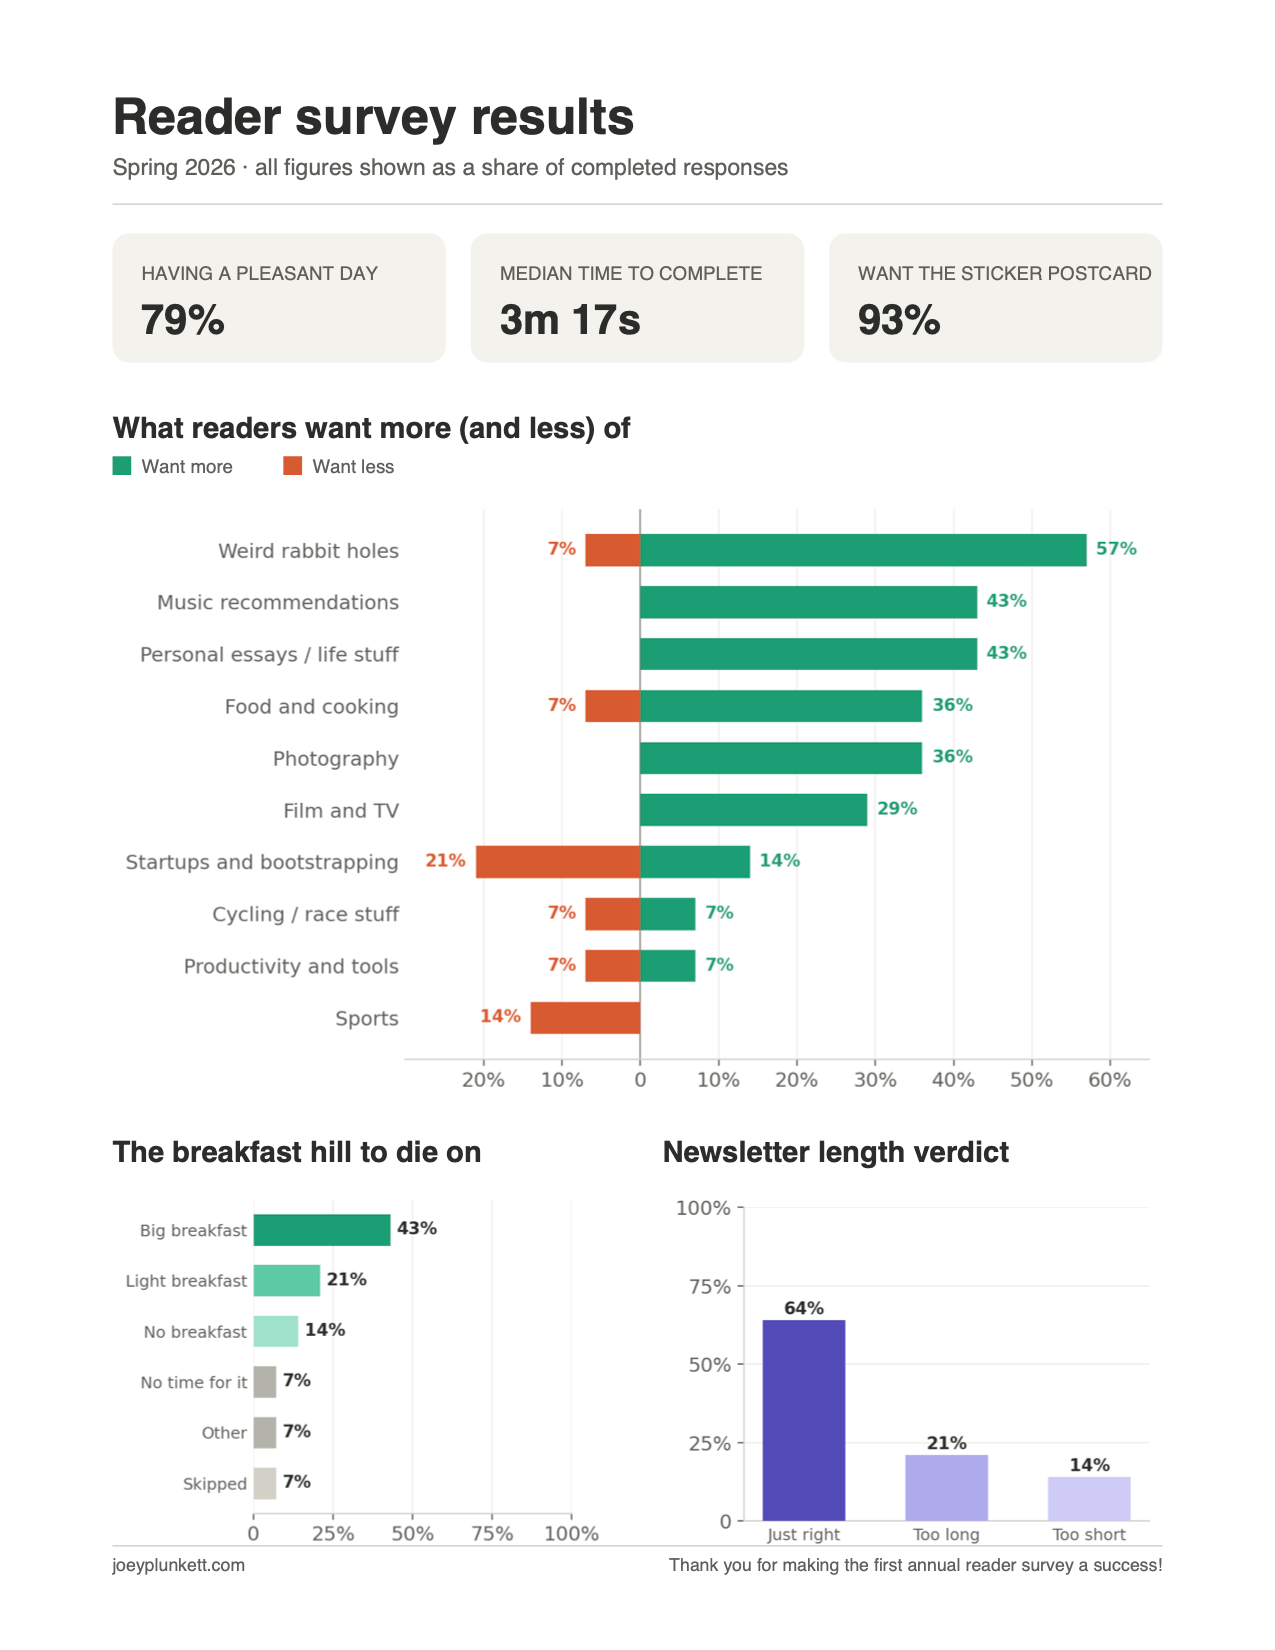
I was delighted to find that the majority of readers responded that they were having a pleasant day. We love to see that. To the 21% of readers who reported that they were in fact not having a good day, I hope this blog post finds you in sunnier skies today.
I was concertend to learn of one tragic character hiding in the survey results: they were not having a pleasant day, wishes they had time for breakfast, thinks the newsletter is too long, and apperently needed to set aide additonal time this weekedn to finish "reading your newsletter." We might need to check on them.
In an attempt to share make sure everyone else benefits from this seminal survey I've collected the collective the responses for readers current music obsessions into a playlist here. I can personally recommend the reader-submitted track Wheels on The Bus, it's a banger.
Now for the deep diving, cross-tabulations, and wild speculating on a small sample group.
I'm happy to report that the newsletter readers are well fed in the morning - 'big breakfast' was the most common response. My hunch of a ‘big breakfast theory’ was also confirmed in the data: 100% of big-breakfast voters reported having a pleasant day.
Meanwhile the lone and aforementioned "I wish I had time for breakfast" respondent was having their bad day, and the breakfast skippers split. The data is clear: it's not skipping breakfast that ruins you, it's wanting breakfast and not getting it.
Extrapolate as wildly as you wish.
Next it turns out the readers' opinion on the newsletter length is kind of a mood ring.
Every person who said the length is "just right" reported that they were having a pleasant day, while the people having a bad day were the only respondents reporting the newsletter is the wrong length - either too long or too short. So I must conclude that the newsletter is objectively and irrefutably the correct length and any complaints are simple projection.
This is the most defensible stat in the whole survey.
Interestingly it turns out that the tool I used for the survey, Typeform, tracks how long a survey takes to get completed, so we're also able to pull some conclusions out of our rear ends using that stat.
Using that metric we can see the "light breakfast on the way out" people - ones you'd expect to be in a hurry - bizarrely took an average of 8.4 minutes to finish the survey, more than double everyone else.
Big-breakfast people cruised through in about 4 minutes.
The no-breakfast folks were fastest at under 3 minutes, which feels right.
Humans are vast and full of contradiction!
Coming to the end, it’s only ten questions after all, the data shows that happiness correlates with thoroughness.
Pleasant-day people spent nearly twice as long on the survey as bad-day people.
Either joy makes you generous with your time, or filling out my survey causes happiness. The data cannot distinguish these and I'm - obviously- claiming the second one. Go me!
Finally most readers thought the newsletter was the right length and wanted to see more weird rabbit holes, music recs, personal essays, food and cooking, and photography. Some readers reported wanting less of sports, productivity and tools, and startup and bootstrapping stuff.
Curiously all anti-sports voters are big-breakfast people, I don't know what to do with that information.
To me - and potentially me alone - this is all fascinating! Never fear though, the readers stated preferences will in no way whatsoever change what I share on the newsletter or blog, but I'm happy to know which pieces are really just for me.
On a serious note, as adult professional humans we're all asked to take so many surveys that are mind-numbingly boring. You can’t escape the ask without disconnecting the internet and stopping the mail. From marketplace surveys to jury summons surveys to ‘tell us how we did’ after a recent purchase, you name it - the surveys we run into in our day to day lives all share one thing in common - they’re all just rather dull.
Hell, I'm hardly clean of this sin as I've made a lot of boring surveys over the years myself. How do I know? Well, when you make a survey you end up taking it about a billion times, so by the end you're painfully aware of how boring it is.
This was the first survey I've ever made with an aspect of 'playing around' to it. Because the stakes are non-existent and I'll never present the findings to a team, I broke structure, asked silly questions, and was less worried about getting it right.
I don't think there's necessarily a lesson in there for professional survey makers, but I know that if you want someone to finish a survey, the equation is something like: how much they care plus what's in it for them (money, prizes, etc), divided by how painful it is to complete. Getting better at the painful-to-complete part sounds cheaper to me than upping the what's-in-it-for-them, and simpler than manufacturing more care.
Member discussion